


How to calculate Portfolio Risk?
There you have ten years, three assets and let us think of those as annual returns. It does not matter whether these are Dollar returns or Euro returns, whether this is our total returns or just the capital gains. Just think of these are the annual returns of the assets and if you want to draw a parallel to the data that we have seen in the previous session. You can think of those as being total returns and all of them measured in terms of Dollars, okay? And as we’ve done before, we can calculate the arithmetic mean return simply by adding up all those observations and divide it by ten and we can calculate the volatility of those assets in a little more convoluted way.
| Year | R1 | R2 | R3 |
| 1 | 25% | 21.3% | 32.5% |
| 2 | 5% | 24.3% | 22.5% |
| 3 | 22.5% | 21.6% | 31.3% |
| 4 | 6.0% | 24.1% | 23.0% |
| 5 | 17.5% | 22.4% | 28.8% |
| 6 | 4% | 24.4% | 22.0% |
| 7 | 31% | 20.4% | 35.5% |
| 8 | 5.5% | 24.2% | 22.8% |
| 9 | 24% | 21.4% | 32.0% |
| 10 | 4.0% | 21.4% | 22.0% |
| AM | 14.5% | 22.8% | 27.2% |
| SD | 10.0% | 1.5% | 5.0% |
We have three assets over ten years and we can see that those assets, as any others, fluctuate over time. They give different, mean returns. In other words, the average return over those last ten years has been different, has been quite a bit higher for asset three than for asset two and quite a bit higher for asset two and then for asset one. But they also have very different volatility. So asset one fluctuated quite a bit. There are no negative returns there in any of the three assets. It does not really matter. But there are no negative returns in any of the three assets. But asset one, as measured by the standard deviation of 10% fluctuated a lot more than asset three and asset three as measured by the standard deviation of 5%, measure fluctuated quite a bit more than asset two, which has a volatility of 1.5%. Remember that is the way that we use this measure of volatility to evaluate uncertainty and variability in relative terms so we can say that asset one fluctuated a lot more than asset three that fluctuated a lot more than asset two, and therefore when I look ahead I have much more uncertainty.
About what returns I can get in the future when I invest in asset one than when I invest in asset three, and then when I invest in asset three compared to when I invest in asset two. So we are not going to go back to the interpretation of those, mean returns and volatilities, but we can calculate those mean returns and volatilities and what that actually shows you is that the most volatile asset of the three was asset one and the least volatile of the assets. Was asset two? Now, remember that what we want to do with this is to combine them in a portfolio and we are going to focus on two portfolios that combine these assets.
| Year | R1 | R2 | |
| 1 | 25% | 21.3% | |
| 2 | 5% | 24.3% | |
| 3 | 22.5% | 21.6% | |
| 4 | 6.0% | 24.1% | |
| 5 | 17.5% | 22.4% | |
| 6 | 4% | 24.4% | |
| 7 | 31% | 20.4% | |
| 8 | 5.5% | 24.2% | |
| 9 | 24% | 21.4% | |
| 10 | 4.0% | 21.4% | |
| AM | 14.5% | 22.8% | |
| SD | 10.0% | 1.5% |
In finance, and particularly in portfolio management, we always think in terms of the proportion of your capital. Therefore, it is not about how much money you have, but it is actually how you split whatever amount of money you may have. In this particular case, we are going to think about building a portfolio with asset one and asset two in very specific proportions, which are putting 13% of our money in asset one and 87% of our money in asset two. Now how would we calculate the return of our 13% in asset one, 87% in asset two portfolios on an annual basis? Well, that is very simple, and the reason it is very simple is that the return of a portfolio in any given period is equal to the weighted average return.
What is weighted average return?
Weighted average return by definition means the returns of each asset in the portfolio multiplied by the proportion of each asset in the portfolio. So if I multiply asset one had a return of 25%, and I am putting 13% of my money in asset one so 25% multiplied by 13% and asset two delivered a return of 21.3%, and I’m putting 87% of my money in that asset. So now, 25%, returning asset one, multiplied by 13%, the proportion of my money invested in asset one, plus the same for asset two, that is 21.3%. Return of asset one multiplied by 87%, the proportion of my capital in asset two, that gives me the return of the portfolio in year one. If I do that, over, and over, and over again. For the ten years for which we have information, then we are going to end up with ten annual returns for a combined portfolio that is invested 13% in asset one and 87% in asset two.
If you actually do those calculations year after year after year, magic. You are going to get a portfolio that gives you exactly the same return give or take a decimal by exactly the same return of 21.7%.
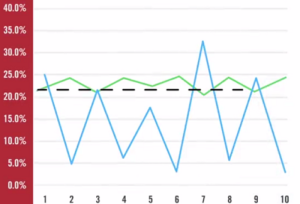
That picture the blue line is actually the return of asset one. In the ten years that we have information. The green line is the return of asset two in the ten years for which we have information. The black dashed line is basically the return of the portfolio fixed at 21.7%. You actually put together two things that are volatile, two things that fluctuate over time and you end up with something that is not volatile, that has no viability over time. Well, this is the magic of diversification. Before we get there, we have one more thing to explore. But one thing that you should keep in mind, for now, is the fact that you are putting together two assets that have fluctuated over time and we end up with a portfolio that has not fluctuated over time.
Now we are going to do another combination. We are going to go back to assets one, two, and three that we saw at the beginning. But now we’re going to combine assets one and three. All right?
| R1 | R3 |
| 25% | 32.5% |
| 5.0% | 22.5% |
| 22.5% | 31.3% |
| 6.0% | 23.0% |
| 17.5% | 28.8% |
| 4.0% | 22.0% |
| 31.0% | 35.5% |
| 5.5% | 22.8% |
| 24% | 32.0% |
| 4.0% | 22.0% |
Now we are going to do another combination. We are going to go back to assets one, two, and three that we saw at the beginning.
Now we are going to combine assets one and three. All right? And we’re going to do it, in this case, it doesn’t really matter the proportions. And because it doesn’t really matter, which is going away to pick 50-50 so we’re going to put 50% of our money in asset one, and 50% of our money in this case, in asset three. So you see the returns of asset one. You see the returns of asset three, and now you know how you calculate the portfolio in each of the return of the portfolio, in each of those years is 50% times a return of asset one, plus 50% times a return of asset two. So for period one that would be 25% multiplied by 50% plus 32.5% multiply by 50%. That is going to give you the return of the portfolio in year one and if you keep doing that repeatedly over the ten years for which we have information then we are going to end up with the return of a 50/50 portfolio in asset one and asset three and when you look at those returns.
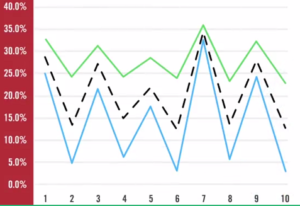
It does not look at all like the combination between asset one and asset two. All those returns are all over the place. So now we’re going to look at a picture. The picture is basically the blue line is exactly the same asset one that we had before. Now the green line, instead of being the asset two we had before, in this case, is asset three. And the black dash line is the return of the portfolio, and as you can see this is a completely different picture from the one before. Before we actually put asset one and asset two together both of which fluctuated over time, and we ended up with a portfolio that did not fluctuate over time. Now we are combining asset one and asset three and we end up with a portfolio and again look at the black line which fluctuates just as much as those two portfolios. In fact, the variability of the portfolio is somewhere in between the variability of asset one and the variability of asset three.
Now here is the interesting question. What is it that determines that in case one, we combine two assets and we end up a portfolio that has no volatility what so ever? In case two, we combine two assets and end up with a portfolio that is very volatile over time. That, in fact, it is volatility somewhere in between the volatility of the two assets in the portfolio. Well if you’re asking that question and that is exactly what you’re wondering. You are exactly on the right track because the answer to that question is given by this incredibly coefficient that we call the correlation coefficient.